In a previous post, I alluded to the use of ApplicationSets for my homelab deployments. I continue to leverage them, to the point I now have quite a number of applications managed by one:
- ArgoCD (Itself)
- Cert-Manager
- Cilium
- External-snapshotter
- Gateway API CRD’s
- Gateway API gateways
- Homepage
- Kanboard
- Kubevirt
- Longhorn
- OpenTelemetry Operator
- Sealed Secrets
- System Upgrade Controller
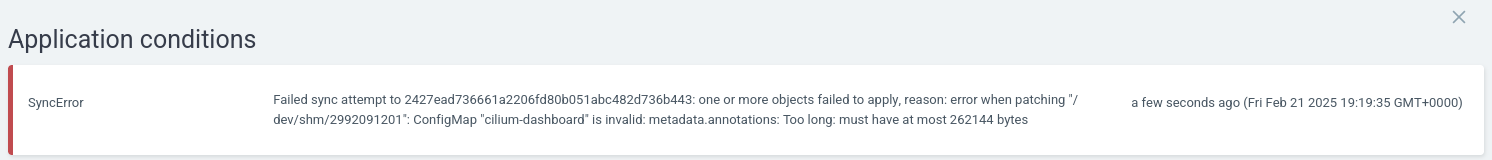
The problem I had, was there was no ordering, dependency management or concurrency limits, so applications would simply update as and whenever changes were pushed.
This caused a number of issues, namely:
- What if ArgoCD updates when another application is or vice-versa?
- What if Cilium updates when another application is or vice-versa?
This could cause some negative outcomes. To mitigate against this, I had a think about how I could group certain applications together, automatically.
Re-arranging the Git Repo
I decided to group applications by directory, reflecting levels of importance:
├── argocd-apps
│   ├── 00-core-infrastructure
│   ├── 01-core-services
│   ├── 02-platform-services
│   └── 03-user-workloads
The directory prefix represents the order, which I reflect in the ApplicationSet:
apiVersion: argoproj.io/v1alpha1
kind: ApplicationSet
metadata:
  name: addon-applications
  namespace: argocd
spec:
  strategy:
    type: RollingSync
    rollingSync:
      steps:
        - matchExpressions:
            - key: orderLabel
              operator: In
              values: ["00"]
          maxUpdate: 1
        - matchExpressions:
            - key: orderLabel
              operator: In
              values: ["01"]
          maxUpdate: 1
        - matchExpressions:
            - key: orderLabel
              operator: In
              values: ["02"]
        - matchExpressions:
            - key: orderLabel
              operator: In
              values: ["03"]
  goTemplate: true
  goTemplateOptions: ["missingkey=error"]
  generators:
  - git:
      repoURL: 'https://github.com/David-VTUK/turing-pi-automation.git'
      revision: HEAD
      directories:
        - path: 'argocd-apps/00-core-infrastructure/*'
        - path: 'argocd-apps/01-core-services/*'
        - path: 'argocd-apps/02-platform-services/*'
        - path: 'argocd-apps/03-user-workloads/*'
  template:
    metadata:
      name: '{{ .path.basename }}'
      labels:
        orderLabel: '{{ index (splitList "-" (index (splitList "/" .path.path) 1)) 0 }}'
The end result being
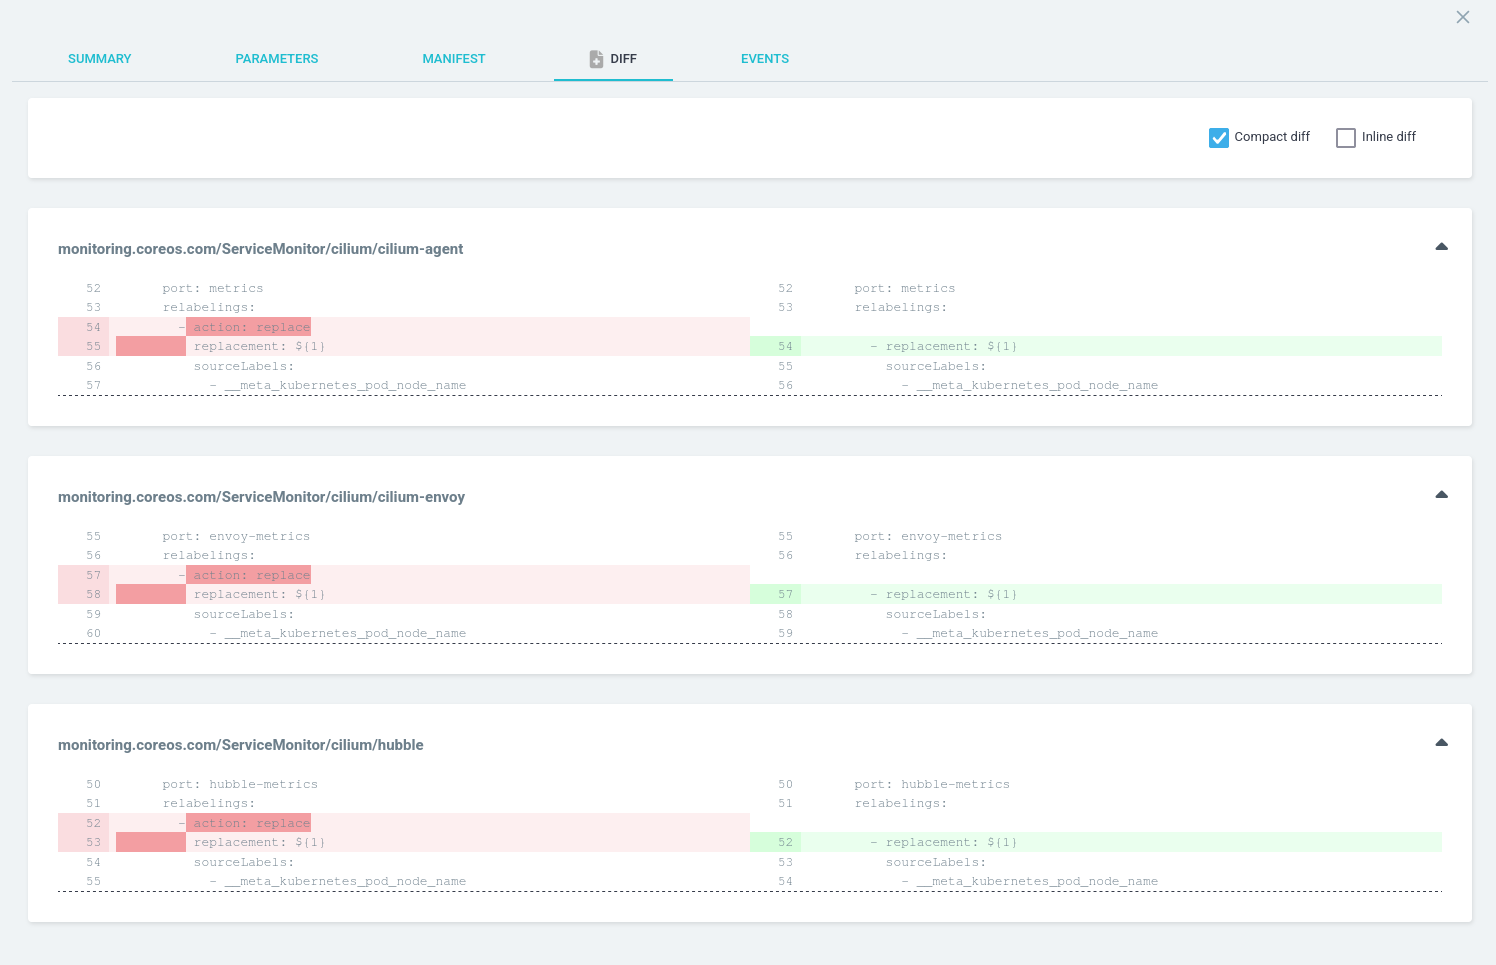
- Applications with the
orderLabel00(folder prefix) will apply first- Only 1 application can update at a time, preventing conflicting apps from trying to update at the same time (for example,
CiliumandArgoCD
- Only 1 application can update at a time, preventing conflicting apps from trying to update at the same time (for example,
- Applications with the
orderLabel 01(folder prefix) will then apply- Only 1 application can update at a time
- Applications with the
orderLabel 02(folder prefix) will then apply.- No concurrency limit
- Applications with the
orderLabel 03(folder prefix( will then apply.- No concurrency limit
Whenever I add a new application I have to decide where it sits in my hierarchy:
- Core Infrastructure (00)
- Examples:
Cilium,Longhorn
- Examples:
- Core Services (01)
- Examples:
ArgoCD, Cert-Manager
- Examples:
- Platform Services (02)
- Examples:
OpenTelemetry Operator,Sealed Secrets
- Examples:
- User Workloads (03)
- Examples:
Homepage,Kanboard
- Examples:
This also helps on the occasion I need to tear down and rebuild my homelab – dependencies are installed in the correct order.

Recent Comments