TLDR; Code repo can be found here. Huge thanks to Spencer for the original blog post that helped me, answering some questions over email, and providing a really helpful Prometheus exporter template (in Go) that I used for this example.
The monitoring framework in Rancher 2.5 was significantly changed – including, but not limited to, giving us the ability to scrape for our own application metrics and creating custom Grafana dashboards. The Monitoring stack in Rancher is a culmination of a number of open-source technologies:
- Prometheus – For collecting and storing metrics into a time-series database.
- Grafana – Analytics and visualisation of metrics (IE Prometheus).
- AlertManager – An extension of Prometheus that enabling configuration of alerts and routing them to notification, paging, and automation systems.
Prometheus Exporters
Prometheus-native applications expose their own metrics which can be scraped from an HTTP endpoint. If we want to capture Prometheus metrics from a system that doesn’t natively export them in this format we need Exporters.
Exporters act as an interpretation layer, taking non-Prometheus formatted metrics and exposing them as such.
Test System – VDSL Modem
My VDSL modem (a EchoLife HG612 with unlocked firmware) does expose some metrics about my connection, but not in a format understood by Prometheus. Accessing /html/status/xdslStatus.asp on my modem returns:
var DSLCfg = new Array(new stDsl("InternetGatewayDevice.WANDevice.1.WANDSLInterfaceConfig","Up","VDSL2","","8852","42044","0","0","8852","40780","0","222","62","134","62","134","Unknown Mode"),null); var DSLStats = new Array(new stStats("InternetGatewayDevice.WANDevice.1.WANDSLInterfaceConfig.Stats.Showtime","90","4294967290","238","127","0","0","32","0","18","0","0","0"),null); var DslUpTime = "0"; var time = 0;
This information gives me some info about my connection. After some quick Googling, I found a reference table that defines what each of these fields relates to.
Writing the Exporter
As the aforementioned metrics aren’t in a format Prometheus can understand, I need to write an Exporter. Prometheus expects to scrape from HTTP-based endpoints, so writing one in go is quite trivial. Prometheus has packages you can leverage to help write your own – which I’ve used as part of the HTTP handler.
func main() {
	//Kick off collector in background
	go collector.Collect()

	//This section will start the HTTP server and expose
	//any metrics on the /metrics endpoint.
	http.Handle("/metrics", promhttp.Handler())
	log.Info("Beginning to serve on port :8080")
	log.Fatal(http.ListenAndServe(":8080", nil))
}
I wrote my own page for collector, which also includes Prometheus packages:
package collector

import (
	"github.com/prometheus/client_golang/prometheus"
...
...
)

// Stats get reset after disconnect, hence the use of Gauge Type
type myMetrics struct {
	UpstreamCurrRate      prometheus.Gauge
	DownstreamCurrRate    prometheus.Gauge
	UpstreamCurrRate2     prometheus.Gauge
	DownstreamCurrRate2   prometheus.Gauge
	UpstreamMaxRate       prometheus.Gauge
...
...
For tidiness, I decided to encapsulate all my metrics into a single instance of a myMetrics struct. Alternatively, you could simply store these in individual variables but with the number of metrics this collects, this seemed to be the more appropriate way.
The Prometheus package also exposes certain types, Guage is heavily used as over time, these values could fluctuate or even reset to 0.
The bulk of the Collector package performs the following:
- Makes an HTTP call to the VDSL modems stats page.
- Uses Regex to extrapolate the quoted values
- Calls a helper function to convert these into
float– which is what theprometheus.Gaugetype expects
//Form Regex to extract all quoted strings
			re := regexp.MustCompile("\"(.*?)\"")
			extractedValues := re.FindAll(bodyBytes, -1)

			modemMetrics.UpstreamCurrRate.Set(convertToFloat(extractedValues[4]))
			modemMetrics.DownstreamCurrRate.Set(convertToFloat(extractedValues[5]))
			modemMetrics.UpstreamCurrRate2.Set(convertToFloat(extractedValues[6]))
			modemMetrics.DownstreamCurrRate2.Set(convertToFloat(extractedValues[7]))
			modemMetrics.UpstreamMaxRate.Set(convertToFloat(extractedValues[8]))
			modemMetrics.DownstreamMaxRate.Set(convertToFloat(extractedValues[9]))
			modemMetrics.UpstreamNoiseMargin.Set(convertToFloat(extractedValues[10]))
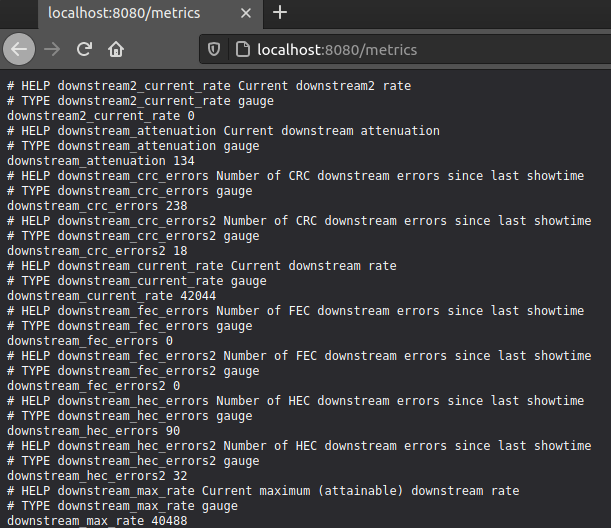
Running this code and navigating to http://localhost:8080 shows the metrics:
Packaging in a Container
In the aforementioned repo, a Github CI job kicks off on a push to package this application inside a docker container, which makes it easy to deploy to Kubernetes.
Scraping with Rancher
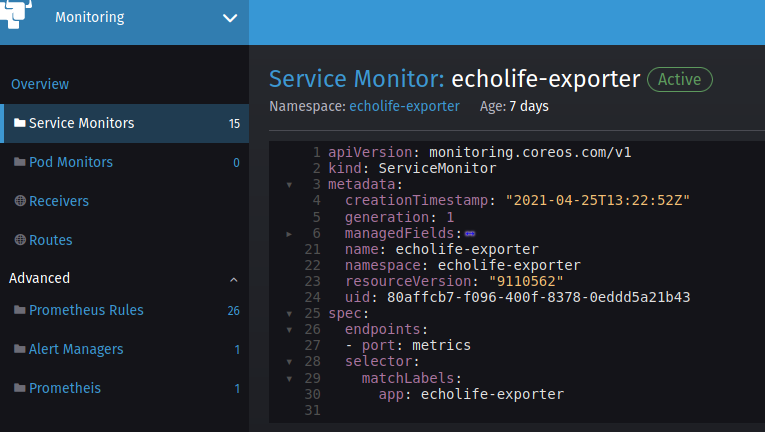
To scrape additional metrics within Rancher (after installing the Monitoring chart), we can define additional servicemonitor objects to specify what needs to be scraped. In this example, I created a simple deployment object for my Exporter container, inside a Pod, exposed by a Service of type clusterIP
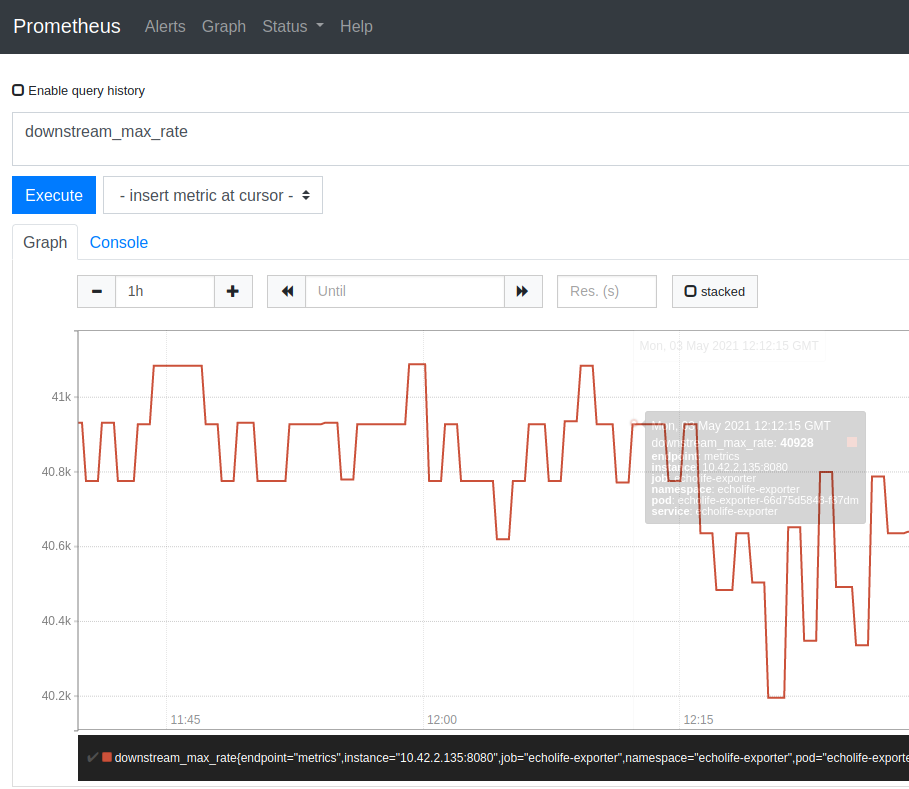
Which we can then inspect the metrics for in Prometheus:
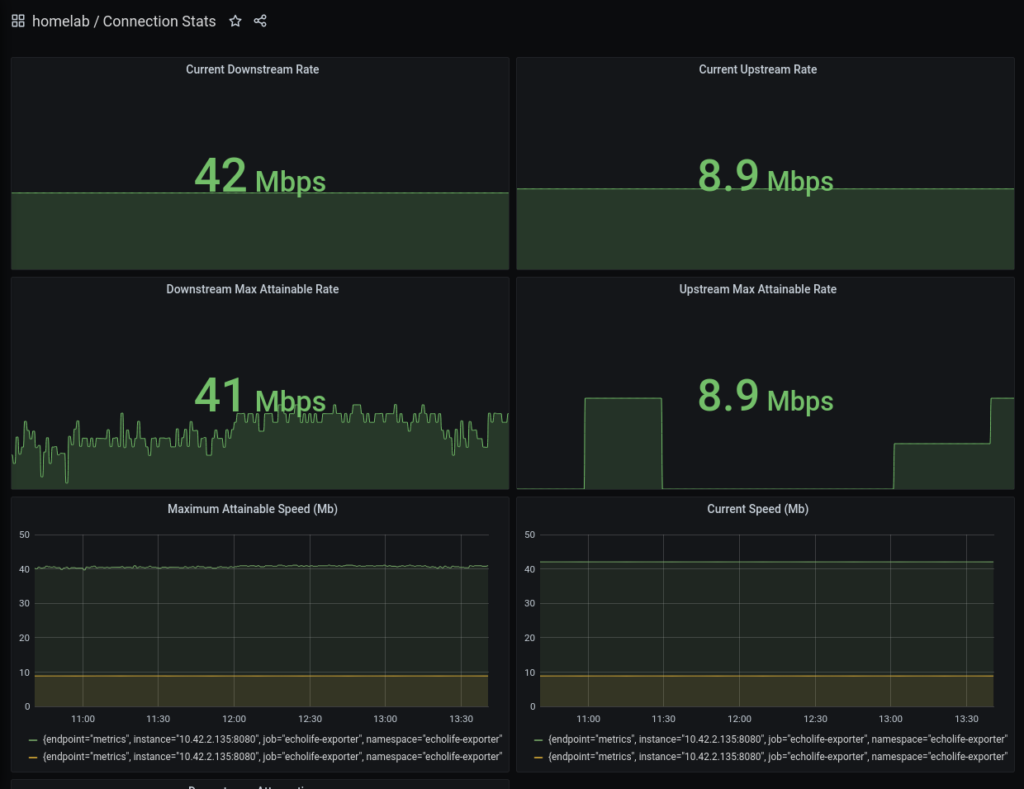
And visualise in Grafana:
Leave a Reply